Climate Services for Agriculture
Agriculture is strongly dependent on weather, hence very vulnerable to weather variability and climatic changes. Climate change is expected to increase weather variability and enlarge the vulnerability of already susceptible regions, including those that are already warm and prone to drought. Rainfall patterns may shift, and with it associated crop calendars and the timing of management activities.
Adaptation is essential to make existing agricultural systems resilient against climatic changes and extreme weather events and to maximize agricultural yield. To assess climate impacts and design robust adaptation strategies, its is essential to have access to reliable, region-specific climate information.
Co-Creation
CLIMTAGTM offers tailored agro-climate indicators that are useful for impact assessment and adaptation planning. The indicators and the CLIMTAGTM user interface are designed and produced via a co-creation trajectory involving the developers at VITO, agro-meteorology experts and local stakeholders.
Data analysis
A wealth of climate data exists. Yet, these data are often inaccessible, due to their difficult format, inappropriate resolution or raw character that is not tailored to the need of stakeholders active in the field. We unlock these data by translating raw climate data into actionable information.
Agro Sector
Decision-makers in the agro-meteorology sector have particular information needs. To respond to these needs, we draw on our own expertise in agro-meteorology and collaborate with experts from National Meteorological Services, Departments of Agriculture, the African Centre for Meteorological Applications for Development (ACMAD) and the Food and Agricultural Organization (FAO).
Would you like to know more? Get in touch!
Climtag Africa
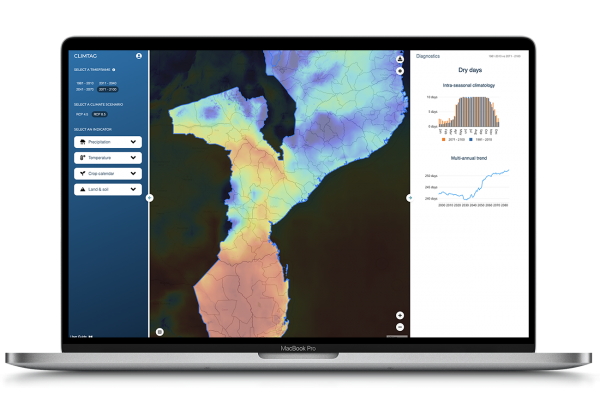
CLIMTAGTM Africa currently offers climate information for three pilot countries, i.e. Malawi, Mozambique and Zambia. In 2021, the tool is being expanded for users in more than 20 African countries. The web-based tool operates at country level and visualises past, present and future climate information. Within the tool, users can select the time horizon and agro-climate indicator of interest. The climate information appears in a dynamic and customisable country map. Within-season variability and future trends can be explored at district level in intuitive graphs. Users can download information for further use in their own work or downstream applications. Users need a personal login to consult country-specific information but a light demo version will also soon be available.
Our cases
There are not articles yet.
The best is the use of climate change data […], as well as the graphs for teaching and preliminary research by students at my university
The tool itself is good and can be very useful for Farmers
Get in touch!
The coffee is on us.


